An open-source context graph for coding agents, built on FalkorDB
Your agent searches the same repo again and again. Give it a map.
Engram turns a repository into one FalkorDB graph: the code, its git history, and what your agents did in it. Before the agent's first tool call it gets a ~200-token map of where to look. While it works, it gets the tests to run, the files that usually change together, and a stop sign if another agent is editing the same file.
No LLM calls of its own. Every answer is a Cypher query.
curl -fsSL https://raw.githubusercontent.com/ManojRakshu/engram/main/install.sh | shRun it inside a repo. No Docker (macOS on Apple silicon; Linux with glibc 2.28+, e.g. Ubuntu 20.04 and later), no database server, no API keys. Node.js is fetched once if missing.
irm https://raw.githubusercontent.com/ManojRakshu/engram/main/install.ps1 | iexIn PowerShell, inside a repo. Native: no WSL, no Docker, no Node.js needed. FalkorDB runs from my Windows build of FalkorDB 4.18.3, pinned by sha256.
{ "mcpServers": { "engram": { "command": "~/.engram/app/plugin/bin/engram", "args": ["mcp"] } } }Use the absolute path. The installer already wires Claude Code, Cursor, Codex, Gemini CLI, Windsurf, opencode, VS Code, Cline and Kiro.
engram setup --url falkor://user:pass@host:portOne team-wide memory on your own FalkorDB or FalkorDB Cloud. Or set FALKORDB_URL.
claude-haiku-5-5 · Claude Code headless · Oct 16–18 2026
§1 An agent spends a third of its calls looking
I counted the tool calls in 83 of my own Claude Code sessions: 32,713 calls. 31% were the agent searching or navigating (grep, sed, cat, find). Only 9% were edits. The median session made 24 search calls before its first edit, and 44% of file views re-read a file the agent had already seen in that session.
Each of those calls re-sends the whole conversation, so the tokens pile up with every step. The next day, on a similar task in the same repo, it searches again from scratch. It doesn't know which tests cover the code, who changed it last week, or that another agent is editing the same file right now.
Aggregate counts only; the sessions themselves are private projects and are not published.
Definition 1.1A map is a short list of exact file:lines symbol locations, the tests that reach them and the verify command that worked last time, ranked by a graph and handed to the agent before its first tool call.
This is the real map Claude Code got for one click bug, "click.Choice(["Apple", "Banana"], case_sensitive=False) rejects apple":
[engram] Likely locations for this task (code graph, confidence high):
- src/click/types.py:406-424 Choice.normalize_choice
- src/click/exceptions.py:51-52 ClickException.format_message
- src/click/types.py:381-386 Choice.to_info_dict
- src/click/types.py:495-515 Choice.shell_complete
Tests: tests/test_types/test_Choice.py
Without Engram: grep, grep, sed, edit. 4 tool calls, 112,298 tokens. With Engram: read, edit. 2 tool calls, 75,733 tokens. Tests passed in both.
Run choice-case, repeat 1, baseline vs cold: bench/results/final/click.jsonl ↗
§2 Four moments in every session
Engram hooks into the agent's lifecycle at four points. Everything it says comes from the graph, and the graph is updated by what the agent does.
| When | What the agent gets |
|---|---|
| Before the first call | the ~200-token map: 3–6 likely locations, the tests that reach them, the verify command that worked last time |
| Before every edit | a block if another agent holds the file (one atomic Cypher write) |
| After every edit | the tests for what changed, and files that usually change with it but haven't been touched; the file is re-indexed |
| On demand | MCP tools: find, impact (blast radius + tests), why (history, experts, lessons) |
Overhead, measured in every benchmark run: the prompt hook takes 149 ms p50 and injects ~221 tokens; tool hooks take ~50 ms and ~14 tokens. Both are included in all the results below.
Source: README, benchmark section ↗
§3 One graph, three layers
One graph per repository (engram:<owner>-<repo>), so repos are isolated without WHERE filters. The useful answers cross layers: "which file usually changes with this one, that this session hasn't touched, and that calls into it" is history, live agent memory and code in one query.
// code
(:File)-[:DEFINES]->(:Symbol)-[:CALLS]->(:Symbol)
(:Symbol)-[:HAS_MEMBER]->(:Symbol)
(:File)-[:IMPORTS]->(:File)
// history
(:Person)-[:AUTHORED]->(:Commit)-[:TOUCHED]->(:File)
(:File)-[:CO_CHANGES {count, weight}]->(:File)
// agents
(:Agent)-[:RAN]->(:Session)-[:READ|EDITED]->(:File)
(:Session)-[:GOT_CONTEXT {rank, used}]->(:Symbol)
(:Session)-[:LEARNED]->(:Lesson)-[:ABOUT]->(:File)
(:Session)-[:RAN_CMD]->(:Procedure {cmd, ok, fail})
(:Session)-[:CLAIMS {intent, since}]->(:File)
Full model and property list: README ↗
The walk grep can't do
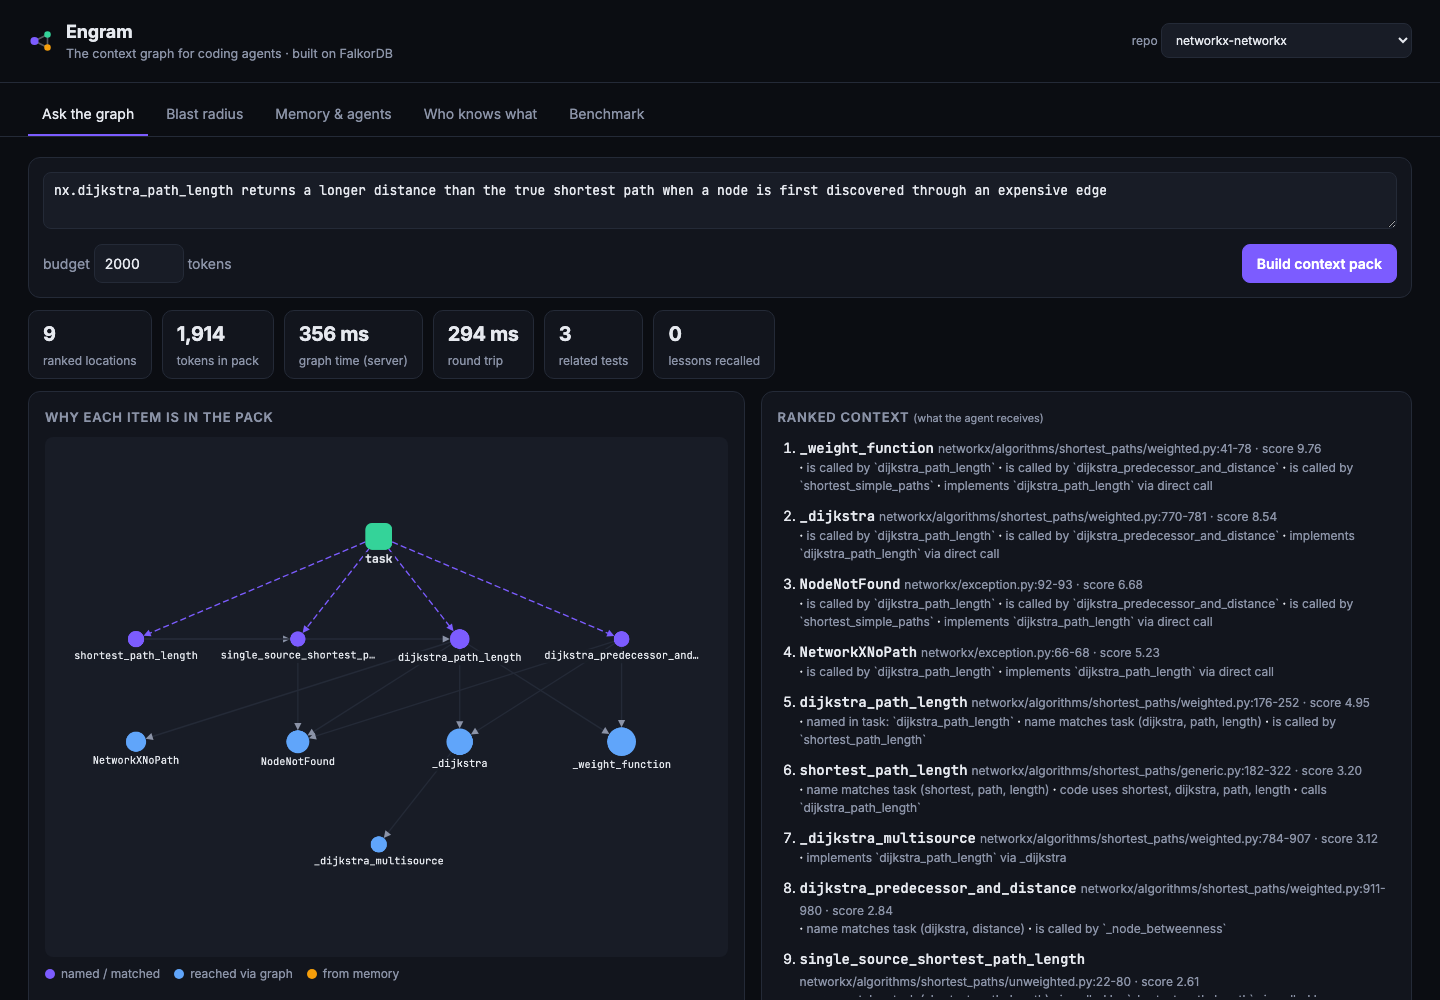
In networkx the report says dijkstra_path_length, but the bug is in _dijkstra_multisource, a few calls down. Engram follows CALLS up to 4 hops, but only through thin functions:
MATCH p = (s:Symbol {id: $api})-[:CALLS*1..4]->(n:Symbol)
WHERE all(x IN nodes(p)[1..size(nodes(p)) - 1]
          WHERE size(x.callNames) <= 6)
RETURN n.qualname, min(length(p)) AS hops
The lock that is one query
FalkorDB runs writes on a graph one at a time, so a single Cypher write is an atomic lock. The same pattern guards edit claims between agents and stops two indexers from writing the graph twice.
MERGE (l:IndexLock {k: 1})
WITH l, (l.owner IS NULL OR l.at < $stale) AS free
SET l.owner = CASE WHEN free THEN $me ELSE l.owner END,
    l.at    = CASE WHEN free THEN $now ELSE l.at END
RETURN l.owner = $me AS got
Every query the product depends on: docs/CYPHER.md ↗ · claim test: test/core.test.ts
§4 Results, with the raw data
How it's measured. Bugs injected into real projects, each validated to break the test suite. The agent sees only a user-style symptom report. Every run gets a fresh single-commit copy, so git diff can't leak the answer. A fix counts only if the full test suite passes. Same model, same harness (claude -p); the only difference is the plugin.
pallets/click: 12 bugs × 3 repeats × 4 setups = 144 runs
| Setup | Fixed | Input tokens (mean) | Median | Tool calls | Search calls | Time | $ / fix |
|---|---|---|---|---|---|---|---|
| Claude Code | 36/36 | 137,600 | 114,704 | 5.1 | 3.4 | 16.4 s | $0.0036 |
| + codebase-memory-mcp | 36/36 | 126,912 (−8%) | 121,922 | 4.7 | 2.8 | 13.4 s | $0.0035 |
| + Engram | 35/36 | 103,467 (−25%) | 96,129 | 3.6 (−29%) | 1.7 | 12.7 s (−23%) | $0.0034 |
| + Engram, warm memory | 35/36 | 104,347 | 98,656 | 3.8 | 1.8 | 13.2 s | $0.0034 |
Per-task geometric mean vs Claude Code: Engram −22%, fewer tokens on 11 of 12 bugs. Source: click-report.md ↗ · raw JSONL ↗
networkx, 128k lines: 6 bugs × 1 repeat
| Setup | Fixed | Input tokens | Tool calls | Time |
|---|---|---|---|---|
| Claude Code | 6/6 | 110,412 | 4.7 | 23.0 s |
| + codebase-memory-mcp | 6/6 | 102,816 (−7%) | 4.3 | 19.7 s |
| + Engram | 5/5* | 84,362 (−24%) | 2.8 (−40%) | 14.8 s (−36%) |
| + Engram, warm memory | 6/6 | 92,220 | 3.7 | 20.5 s |
* One cold run was not executed (the account's usage limit stopped the run), so it counts as neither pass nor fail. Only the complete first repeat is reported. Source: networkx-report.md ↗
A messy real project: yt-dlp's own bug reports
yt-dlp: 1,128 Python files, 248k lines, years of community patches. I indexed it as of 30 April 2026 (4.0 s) and took every later fix that closes a GitHub issue. Engram gets only the issue the user wrote and is scored against the functions the maintainers actually changed.
- 30 real issues, zero LLM tokens: right file in the top 3 for 22/30; the fixed function in the top 10 for 20/30 and on the map for 17/30. Median 240 ms.
- Live Claude Code on 4 of them (one run each, fix not in git): both setups found the right file and function 4/4; with Engram −31% tokens, −33% tool calls, −24% time.
bench/realworld.ts ↗ · realworld.json ↗ · realworld-live.json ↗
Retrieval alone, zero LLM tokens
Before any agent runs, how often does the map point at the bug?
| click (12) | networkx (6) | |
|---|---|---|
| buggy file in top 3 | 10/12 | 6/6 |
| buggy function in top 10 | 8/12 | 6/6 |
| on the ~200-token map | 8/12 | 6/6 |
| time per pack | ~20 ms | ~90 ms |
Honest notes
- One miss in 36 on click. The agent edited the 5-line wrapper
_normalize_optinstead of_split_opt, which it calls. The map had listed the wrapper and named the real function only as its next call. Fixed after the benchmark (a thin wrapper's delegate now gets its own line); the benchmark was not re-run, so the number stays 35/36. - Small scope. One model (Haiku), 18 injected bugs in two Python repos, plus 30 real issues. networkx has one repeat.
- Cost per fix drops less than tokens (−6%), because most input tokens are cheap cache reads.
- Warm memory helps less than cold on click (−24% vs −25%). An early version of memory made things worse; that story is in the blog post.
- My first benchmark leaked the bug through
git diff. I caught it, rebuilt the harness, and discarded those runs.
§5 Why FalkorDB
The graph has to answer before every prompt without the agent waiting. Take FalkorDB out and nothing is left: the map, hints, claims, memory and blast radius are all Cypher on the graph.
| Engram needs | FalkorDB gives |
|---|---|
| Multi-hop walks inside a hook's time budget | sparse-matrix (GraphBLAS) traversal; Engram's queries take 1–40 ms; the cross-layer hint ~11 ms |
| Atomic claims between agents, no lock service | writes are serialised per graph, so one query is the lock |
| One isolated graph per repo, many per instance | built in (engram:<repo>) |
| PageRank, communities and full-text in one engine | algo.pageRank, algo.labelPropagation, full-text indexes |
| Small enough to run beside every agent | FalkorDBLite, embedded: 43–60 MB RAM at rest with networkx; 2.8 MB on disk |
| Team memory when you want it | point everyone at one FalkorDB or FalkorDB Cloud with --url |
Measured on one Apple-silicon Mac, Oct 17 2026. Source: docs/COMPARISON.md ↗
§6 Compared, including where Engram is behind
Only codebase-memory-mcp was benchmarked side by side (results in §4). The others are described from their own docs and marked so.
| Install | Needs first | Database | LLM calls / API key | |
|---|---|---|---|---|
| Engram | curl … | sh | nothing | FalkorDB, embedded | none |
| codebase-memory-mcp | curl … | bash | nothing | embedded SQLite | none |
| mem0 (from its docs) | pip install mem0ai | Python | vector store | yes, an LLM extracts memories |
| claude-mem (from its docs) | Claude Code plugin | Claude Code | local SQLite | yes, Claude compresses memories |
Speed and size on networkx (128k lines)
| codebase-memory-mcp 0.12.0 | Engram | |
|---|---|---|
| Index from scratch | 3.7 s | 2.7 s (code + 1,175 commits) |
| Peak RAM while indexing | 221 MB | 242 MB |
| Index on disk | 88 MB | 2.8 MB |
| Install size | 335 MB binary | ~59 MB (+109 MB Node.js only if missing) |
Scope differs: codebase-memory-mcp also indexes docs and config; Engram indexes source code plus git history. Commands are in COMPARISON.md ↗
Where Engram is behind
- Fewer agents wired automatically: 9, against codebase-memory-mcp's 45. Any MCP client still works with one line of config.
- Platforms: embedded FalkorDB covers Apple-silicon macOS, Windows x64, Linux x64 with glibc 2.28+ and arm64 with glibc 2.35+, started in CI on AlmaLinux 8, Debian 11 and 12, Ubuntu 20.04 and 22.04 and Amazon Linux 2023. Intel Macs and Alpine fall back to Docker or
--url. Windows gives identical results but is slower: a map takes 0.09–1.1 s, against 0.02–0.5 s on Linux and macOS. - Languages: Python, TypeScript and JavaScript.
- Peak indexing RAM is slightly higher (242 MB vs 221 MB).
§7 Install, use, remove
Real output from a fresh user profile whose PATH had only system directories (no Node, Docker or Homebrew):
engram: fetching Node.js v22.23.1 (one time)…
FalkorDB
  · downloading FalkorDB (FalkorDBLite 0.10.0, one time)…
  · starting embedded FalkorDB…
  ✓ running (embedded, ~/.engram/falkordb.sock)
Agents
  ✓ Cursor: added to ~/.cursor/mcp.json
  ✓ `engram` command: ~/.local/bin/engram
This repo
  ✓ indexed networkx-networkx: 695 files, 1175 commits in 4.4 s
25 s in total, most of it the two one-time downloads. With Node.js already installed, about 4 s.
# the map an agent would get
engram pack --compact "describe a bug"
# blast radius: callers, tests, owners
engram impact src/some/file.py
# any CLI agent that takes a prompt
engram run "fix the flaky retry" -- codex exec {prompt}
# disconnect every agent, stop FalkorDB
engram setup --remove && engram db stop
Every feature can be switched off in engram.config.json or with ENGRAM_PACK, ENGRAM_JIT, ENGRAM_MEMORY, ENGRAM_CLAIMS or ENGRAM_HISTORY set to 0. Delete ~/.engram to remove everything; Engram writes nothing else.
§8 Questions
Does Engram call an LLM?
No. Every answer is a parameterised Cypher query on FalkorDB. It adds only the ~200-token map it injects (and ~14 tokens per tool hint), and it works with whatever model your agent uses.
Why a map and not the code itself?
Whatever you inject gets re-read on every later turn. My first version gave the agent 1,600 tokens of code and history, and token use went up. Claude Code has to Read a file before editing it anyway, so pasting code never saved a call. Six lines of exact locations did.
Do I need Docker or a database server?
No, on macOS (Apple silicon), Windows x64 and Linux with glibc 2.28+ (2.35+ on arm64). Engram runs FalkorDBLite, FalkorDB's own embedded build, or on Windows and on Linux older than Ubuntu 24.04 my build of the same FalkorDB release, pinned and checked against its sha256. Intel Macs and Alpine need Docker or a FalkorDB URL. It runs as one small server per user on an owner-only Unix socket in ~/.engram, shared by every agent on the machine. If it isn't up yet, the agent works as usual and Engram switches on at the next prompt.
How does it stay current while I edit?
Every edit re-indexes that file, and each new prompt re-checks file hashes, so indexing is incremental. Git history is mined for authors and co-change.
What stops two agents editing the same file?
Before an edit, the agent's session claims the file in one Cypher write. If another running session holds it, the edit is blocked with a message saying who has it. Claude Code, pi and any MCP agent share the same claims.
Why no language servers or embeddings?
Language servers want hundreds of MB, and a June 2026 study found LSP tools added 6–118% tokens on code-localization tasks (arXiv 2608.13568). Bugs here are found by structure (calls, history), and FalkorDB has a vector index if embeddings are ever worth adding.
Did it ever make things worse?
Yes, and it's all written down: the 35/36 miss on click, an early memory that stored the exact test command and confused the next task, and the 1,600-token pack that raised token use. See the honest notes in §4 and the blog post.
Is it free and open source?
Yes, MIT licensed. The source, the benchmark harness and every raw result are on GitHub.